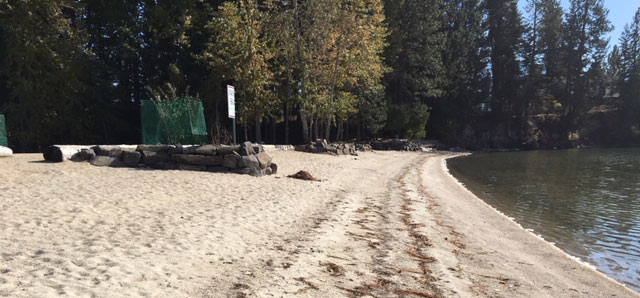
In casual conversation with long-time residents and stake-holders on the lake, the most oft-heard comment was, “it’s low, not the lowest it’s ever been; I’ve seen it this way …. twice since I’ve been here.” Twice! These memories bring two questions to mind: what’s “normal” and why is the lake level low this year?
How Low is Low?
I want to be able to say with certainty what the “normal” lake level – also known as lake elevation – is this time of year. I searched for data that could tell the story, starting at the Hayden Lake Marina. That’s where the gauge is – or was until it disappeared last spring!
At the Hayden Lake Marina, a gauge once stood beside one of the docks. The post on which it was mounted rotted away and fell into the water. A new piling has been identified and a marker for the Ordinary High-Water Mark (OHWM) installed. But, alas, no scale is in place. More-importantly, while the old gauge made spur-of-the-moment checking a breeze, there is no historical data associated with it.
I then worked through every state and county agency that might have an interest, the University of Idaho, the City, and the Country Club. No historical data exists within reach at those sources. Finally, in my second call to IDWR, I hit water“I hit water!” – to strike it rich, hit pay dirt, strike oil – because water is liquid gold.. Daniel Sturgis, the Hydrogeologist in DWR’s Northern Region, took an interest in my little investigation and, in the course of our conversation, gave me insight into the USGS’s National Water Information System that archives Hayden Lake data spanning from 1920 through 2018.
Today’s (12/4) Lake Elevation: -6’1″ and Dropping
While searching for and analyzing the numbers, I decided to fill in for the missing USGS data collector. I measured the lake elevation myself, from the new marker at the Hayden Lake Marina:
- Oct 25 = 5′ 7″ below the Ordinary High-Water Mark (OHWM)The Ordinary High Water Mark (OHWM) of Hayden Lake is 2239 feet above sea level. The State of Idaho owns, “in trust for the public, title to the bed of the navigable water below the OHWM as it existed at the time the state was admitted to the Union” (1). (July 3, 1890) This public property is in the care of the Idaho Department of Lands.;
- Nov 6 = 5′ 10″ below;
- Nov 19 = 5’11” below;
- Dec 3 = 6′ 1″ below.
What Does the Data Say?
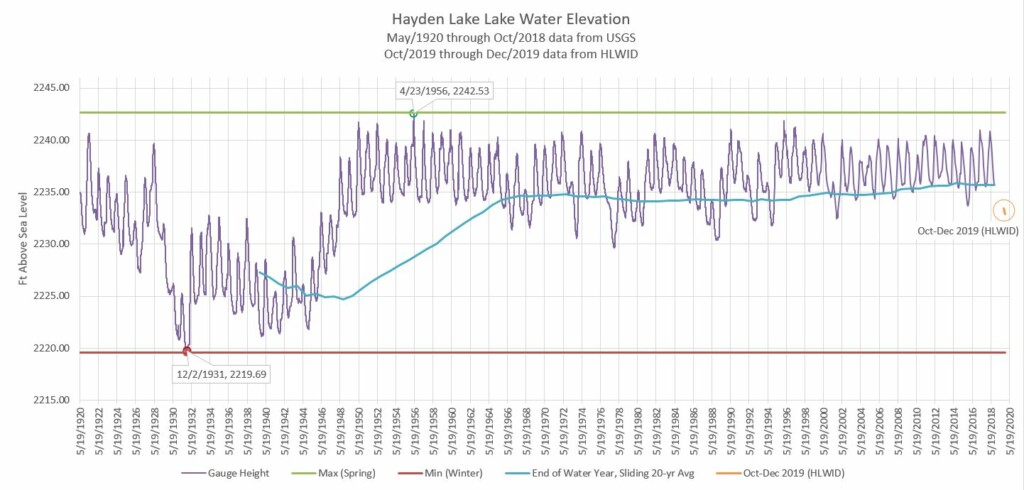
The USGS collected lake elevation data daily from May 19, 1920, through July 31, 1999. From then through August 30, 2018, data came in about monthly. We don’t know why the data collection stopped at that point. Maybe that’s when the gauge went out of commission.
 The graph of the data tells a complex story about how Hayden Lake has behaved over the decades. We can see a dramatic 20-year low in lake elevation that spans the dust bowl, the depression, and most of WWII. We see a new norm established in the seasonal rise and fall of the lake over the next 20 years. A period of more extreme variability follows from the mid-60s through the end of the 20th Century. And the variability has been less over the last 18 years.
Now, in the winter of 2019, we can see that our most recent end-of-water-year the 12-month period from October 1 of any given year through September 30, of the following year. The water year is designated by the calendar year in which it ends and which includes 9 of the 12 months. Thus, the year ending September 30, 2019 is called the “2019” water year.level was about 2 feet below the 20-year average. The lowest of the low typically comes along in December, two months after the end of the water year. Over the last 20 years, the two lowest points were reached in 2016 – 6 inches above Dec 3’s level – and in 2001 – about 6 inches below Dec 3’s level.
That was a lot of work to say, yes, the lake is low this year, and unusually so. And, those long-time residents on the lake hit the nail on the head. The lake has been to this point twice in our easy-to-recall history.
Has the lake level bottomed out? Stay tuned; I’ll let you know!
As for the “why” question, the answer is elusive. I’ll try to “think out loud” about that in future posts as well.


2 Responses
Thanks. That was very interesting
Thank you for all your work Mary Ann!
Comments are closed.